Debugging ILE programs is now available inside of Visual Studio Code. We’ve added UI to make sure setting up the Debug Service to be a swift process.
Starting to debug
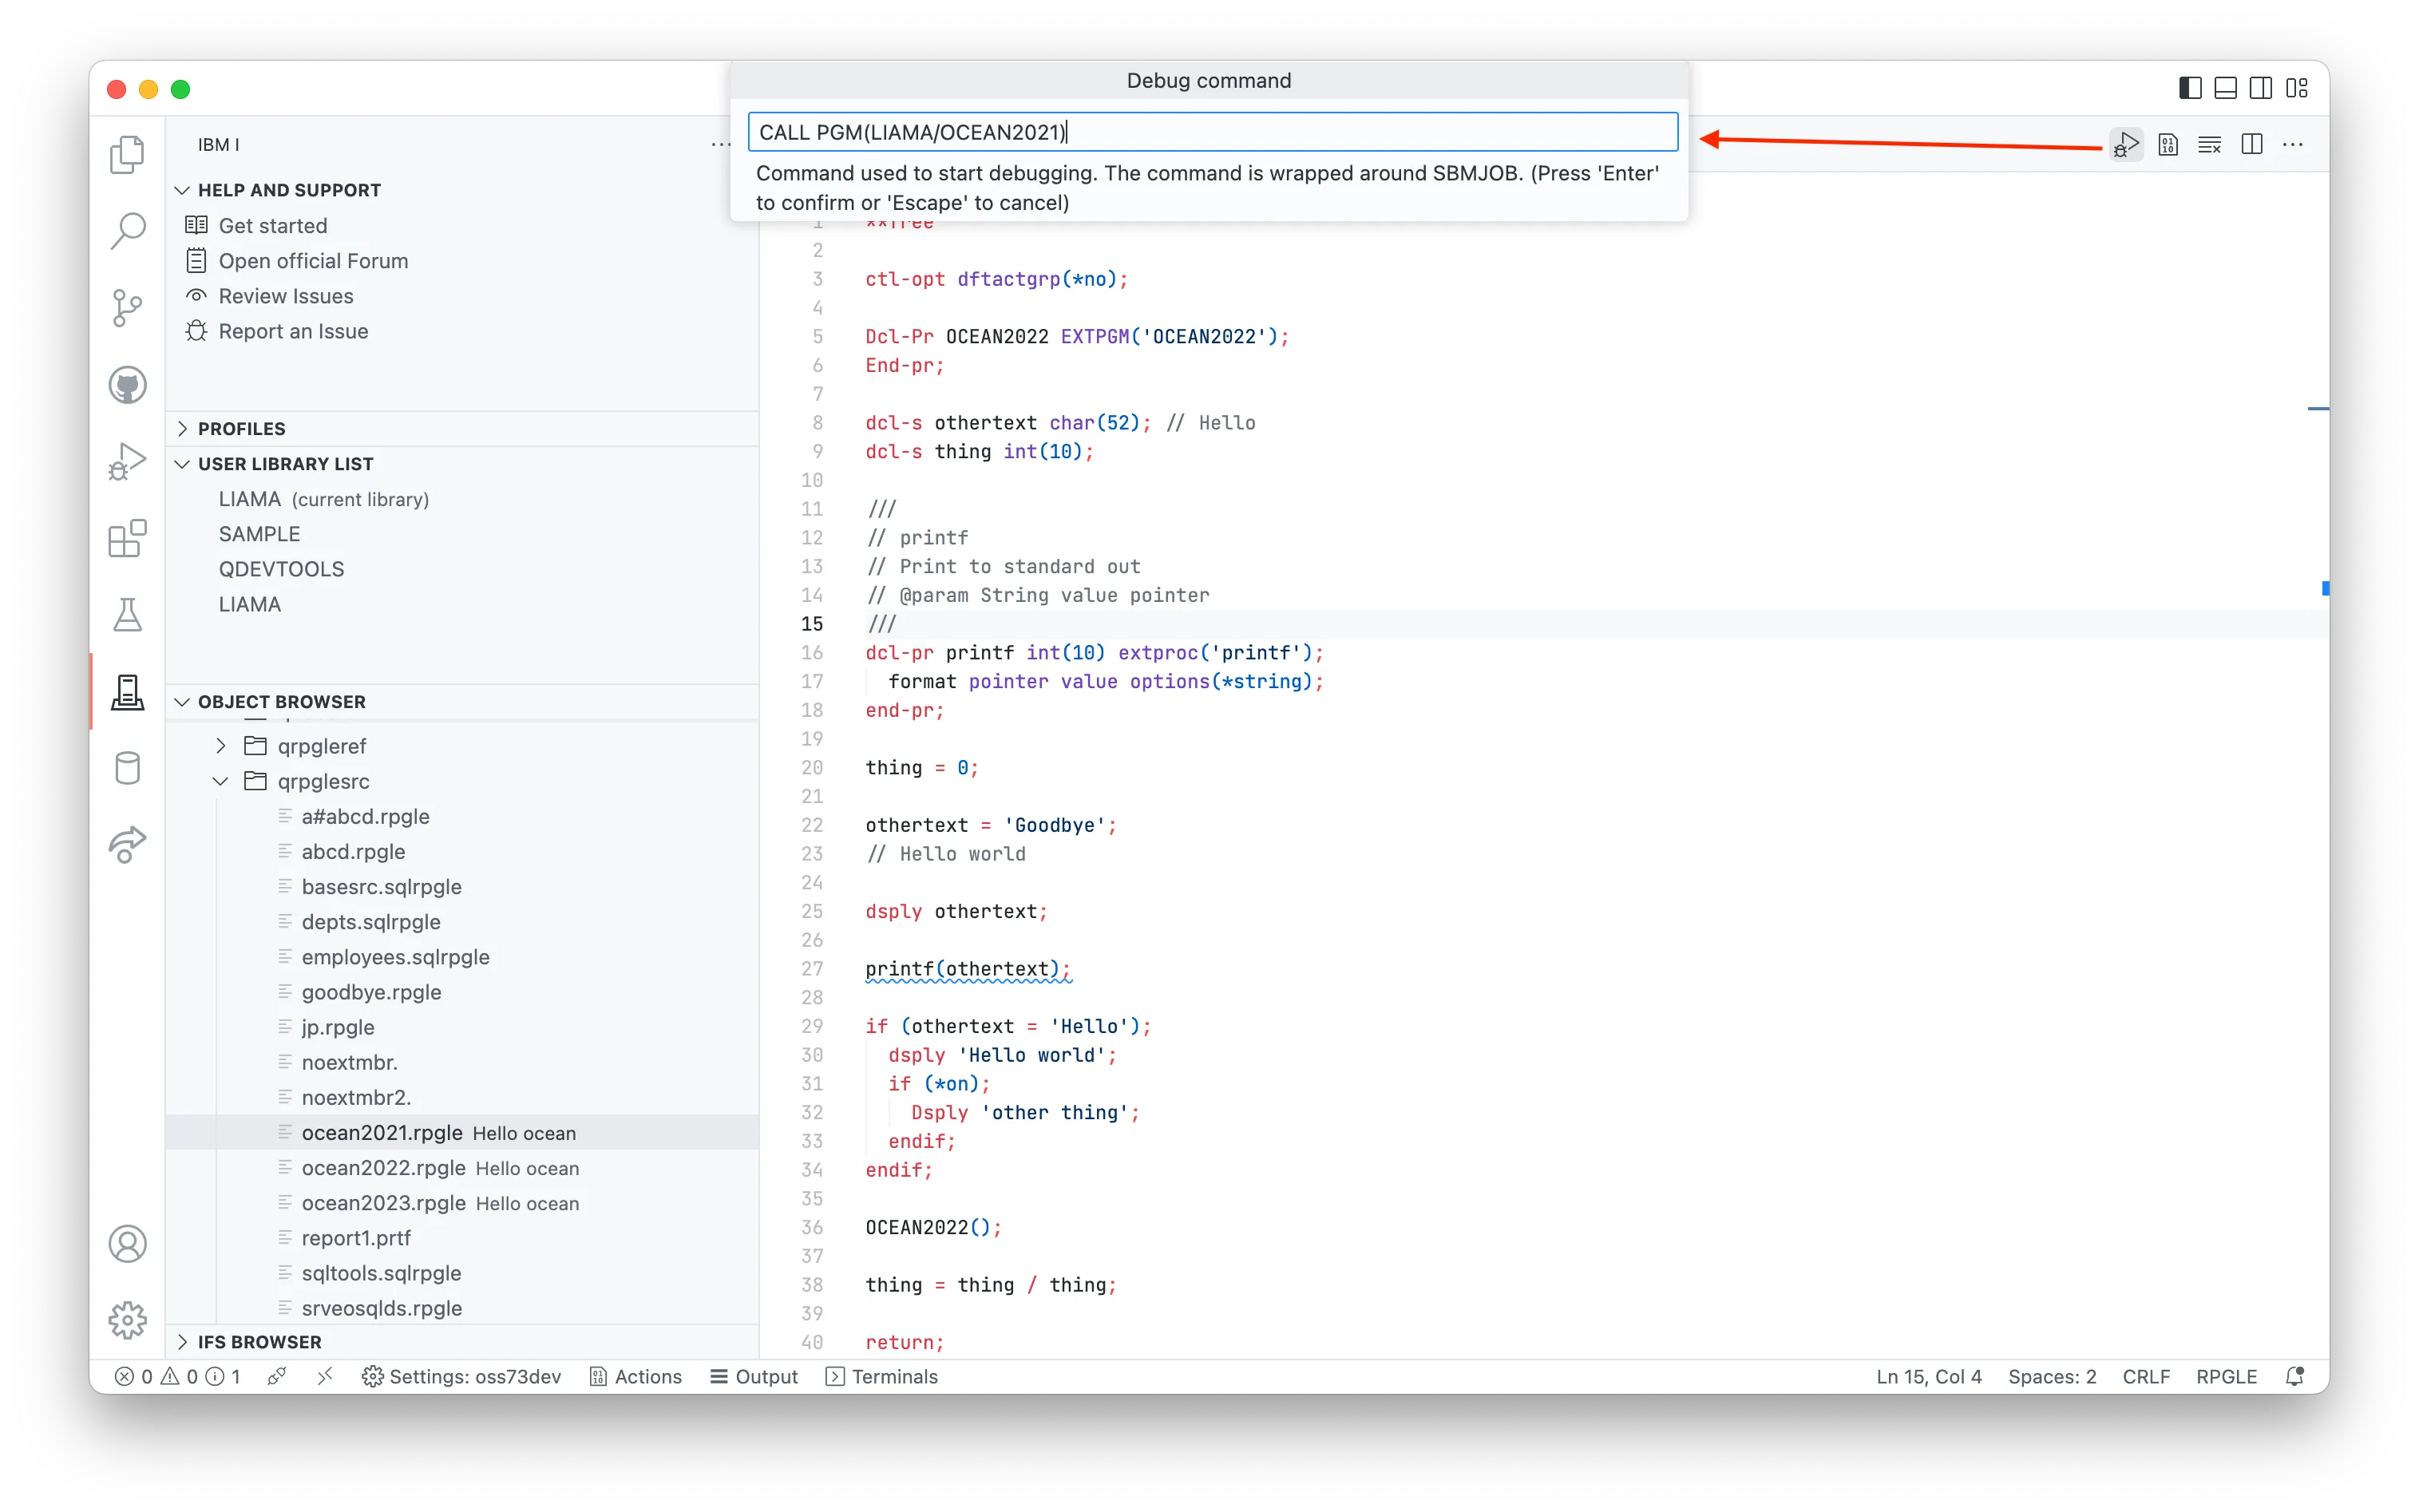
After configuring the Debug Service, launching a debug session is a click of a button away. When you have active source open, a new Debug button will appear in the navigation bar. Breakpoints can be set prior to debugging, or during the debugging session.
Clicking the Debug button will display an input box which will allow the user to customise the command which starts the debug job. This allows the developer to pass in parameters, or call another program to launch the debug session.
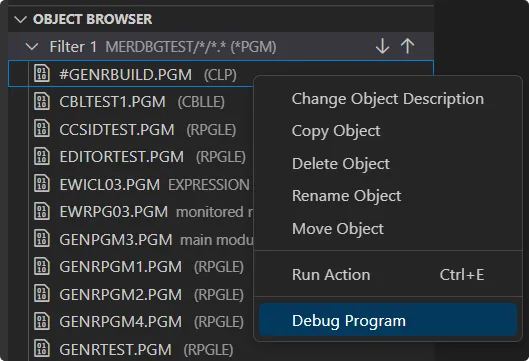
To debug a program from the Object Browser, right-click on the program object and select the Debug Program option. Like before this will also display an input box to modify the command which starts the debug job.
As of Code for IBM i 2.16.0, the Debug Service is configured inside of Navigator for IBM i. If you’re using Code for IBM i 2.16.0, then you are required to use this method to configure and start the Debug Service. Code for IBM i 2.16.0+ supports only Debug Service 3+.
Required PTFs
To make use of the Debug Service, you need the following PTFs:
After you have installed the PTFs, the connection inside of Visual Studio Code will need to be restarted.
Configuring & starting the service
This must be done with user that has *ALLOBJ and *SYSADM privlages.
Below are the base requirements to configure the certificate:
Master key 1 is set (this can be done in Navigator for IBM i under Security > Cryptographic Services Key Management > Manage Master Keys)
*SYSTEM store is populated with a valid certificate (this can be done in Digital Certificate Manager)
On Navigator for IBM i, go to Network > Servers > TCP/IP Servers
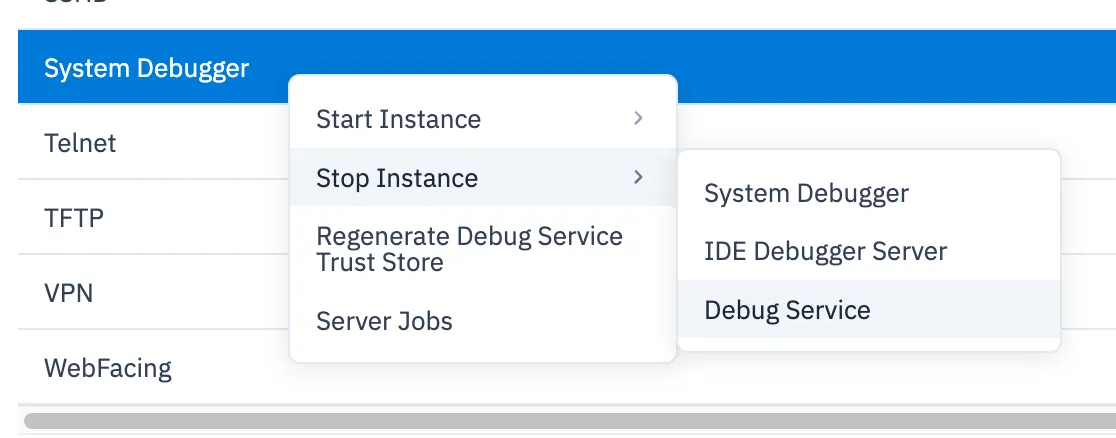
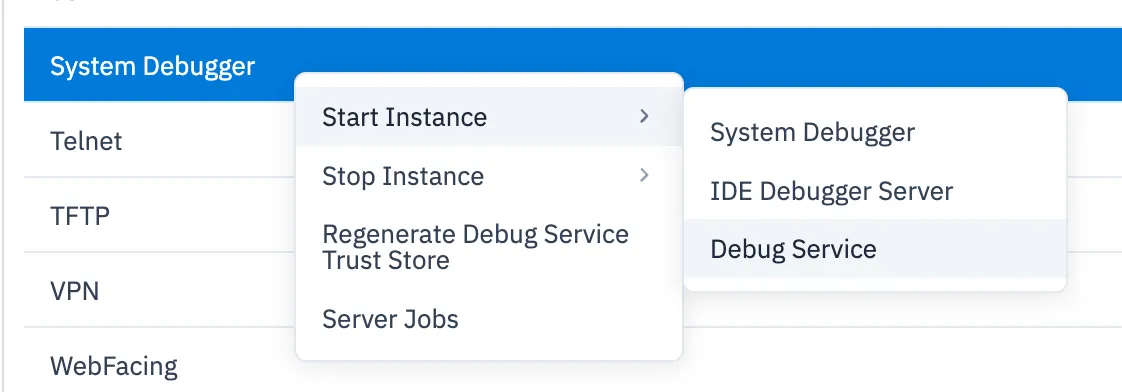
Scroll down to System Debugger and right click
Hover over Stop Instance, select Debug Service
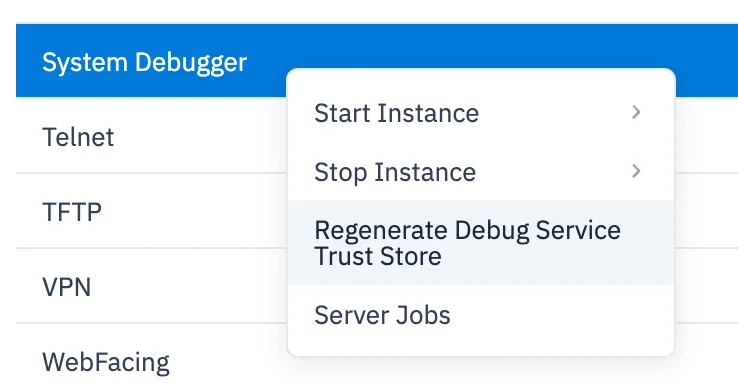
Right click System Debugger again, select Regenerate Debug Service Trust Store
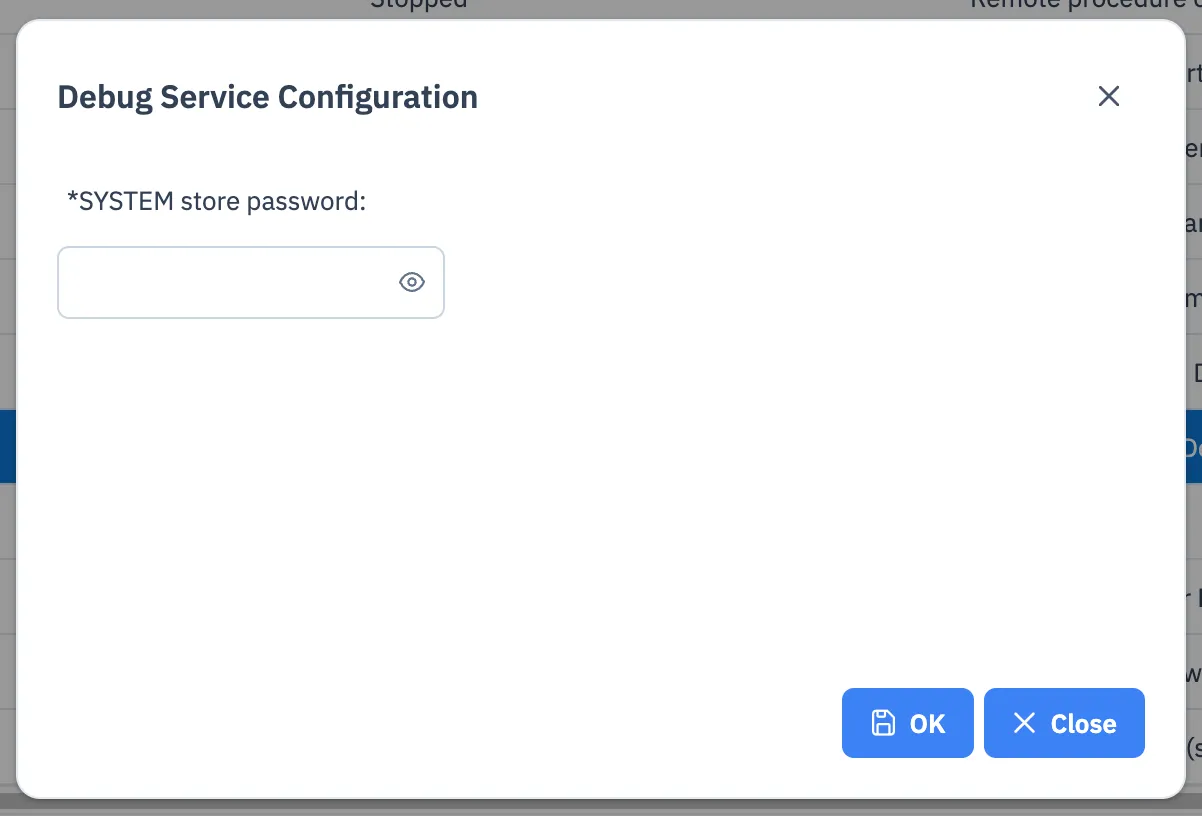
Enter in the password for the *SYSTEM store, click OK
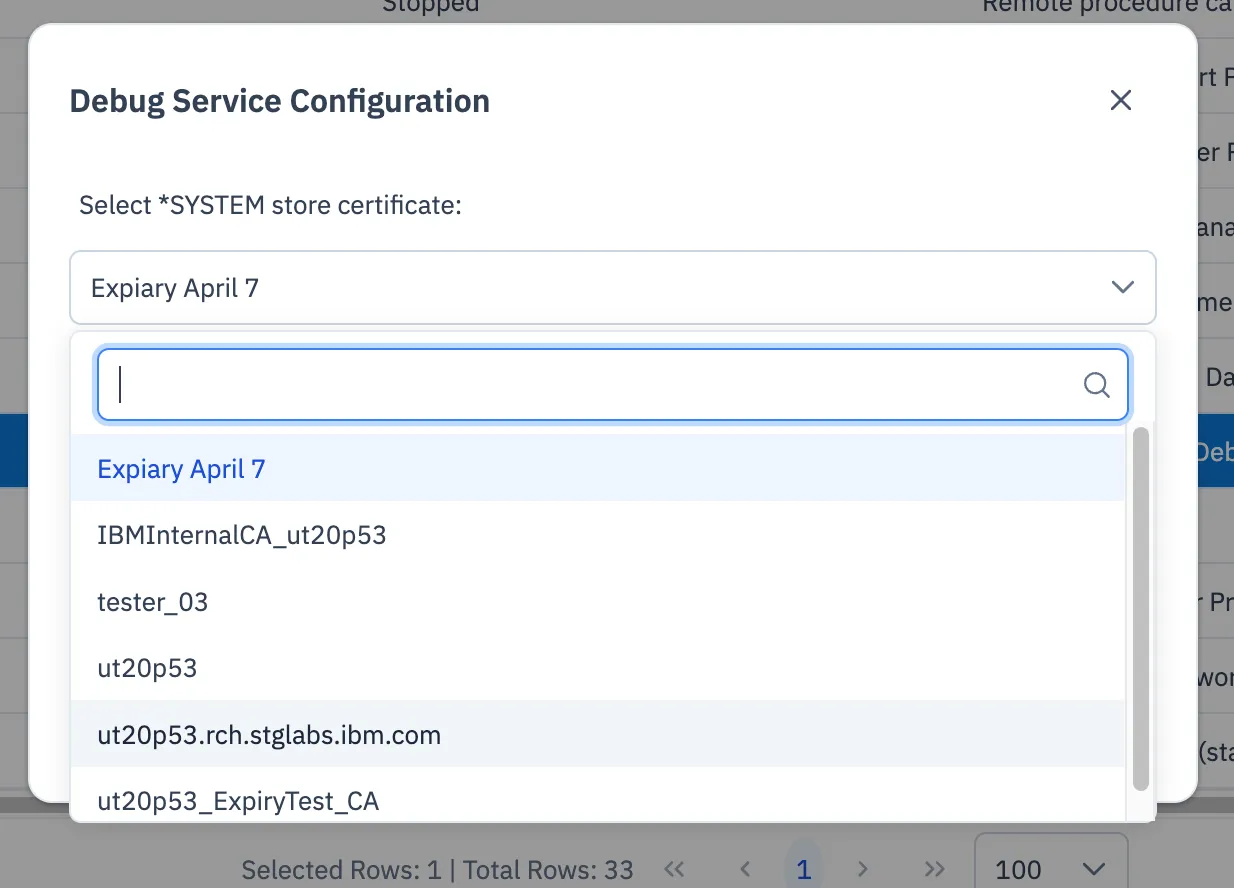
Select the certificate you want to use, click OK
Right click System Debugger again, hover over Start Instance, select Debug Service
NOTE: This needs to be done each time you renew or replace that certificate, it does not automatically update when you update the *SYSTEM store
Common issues
Debug hangs
There is a known issue that when you start debugging from VS Code, the debugger hangs and doesn’t launch.
The fix is to check if you’ve got a prior debug job stuck in MSGW. You can do this with WRKACTJOB, or a similar command like WRKSBSJOB QBATCH.
Users should no longer face this issue as we now submit debug jobs to QSYSWRK with QSYSNOMAX.
STRDBGSVR requirement
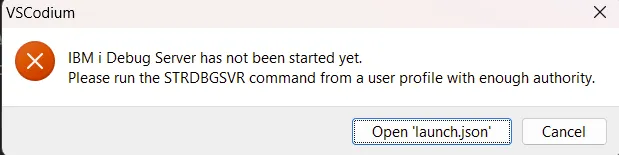
The Debug Service that is started depends on the traditional Debug Server.
If you receive this message, do as it says. Simply start the Debug Server with STRDBGSVR from a greenscreen.
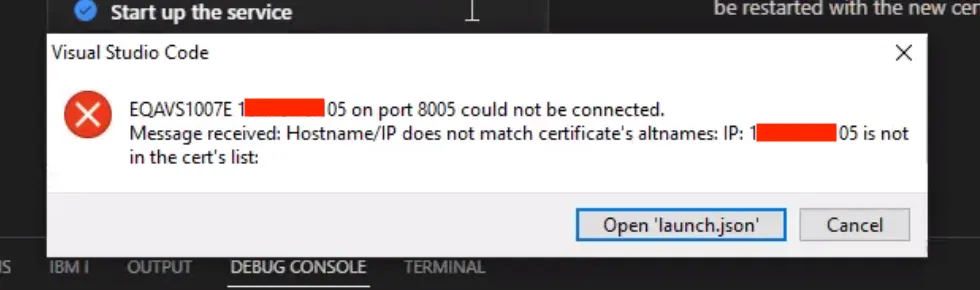
IP not in cert list
It is always recommended you use a hostname in the connection settings to make use of the debugger.
Error that is shown when connecting to the debugger if connecting using an IP address.
This error occurs when the hostname used to connect to the debugger (which might be the IP address that was configured in the connection settings) is not the same as the host name created as part of the certificate.
If you are using a system that doesn’t have a host name (for example YOURSYSTEM, or pub400.com), then an entry should be added to your device’s ‘hosts’ file. This entry should be the same on all devices in your network to ensure that everyone is using the same hostname.
Windows: c:\Windows\System32\Drivers\etc\hosts
Mac: /etc/hosts
Your entry might look like this:
hosts
# IP HOSTNAME
192.168.0.20 MYIBMI
If you find that you’ve added your local hostname entry and the error is still occurring, then you may need to delete the existing certificates from /QIBM/ProdData/IBMiDebugService/bin/certs on the IFS and generate them again in the Walkthrough.